Expected Wait Time If Delayed
I'll first start with discussing how long you may be postponed in the event your plane is delayed. As discussed previously, we are now cognizant of the times of day when JFK, LaGuardia, and Newark experience increased delays (see original chart on this topic). But this is useful only when you can choose your departure time. What if you travel for work, and the soonest you can leave NYC is on an evening flight (when delay potential is highest), how long will you be waiting on the tarmac? First, let's look at how long delayed flights wait before departing from each NYC airport. The below charts show the range of delay for each airport; the x-axis shows the amount of delay (in minutes) and the y-axis shows the percent of flights that experience that particular amount of delay.

As you can see, in addition to being very similar, the graphs (called histograms) start high and quickly decrease. This means most delayed flights have a shorter wait time and a few outlier flights have very long delays (some are over 6hrs). You can find the average of all delays (~61 minutes for each airport) but your calculation would be misleading, it would be too high. Why? Look at the shape of each histogram - they are significantly skewed to the right. Because they are not symmetrical (like the 'classic' bell curve / normal distribution curve) the average is skewed - in this case skewed to the right (i.e. higher). The outliers far to the right are responsible for this misleading average calculation. A better measure of delay in this case is the median. The median is found by lining up all delay times from smallest to largest and selecting the middle value. Because of how it is calculated, the median is much less prone to being skewed than the average. For all airports, the median delay time is ~40mins. Here are the histograms again with the median and averages placed on top:

So, expect to wait about 40 mins if your flight is delayed, regardless of airport, right? Almost. Rarely (if ever) can performance be summarized by a single number. In reality, there is a performance range. For example, the percent chance a flight is delayed less than 20 mins, less than 30 mins, more than 60 mins, etc. You get the idea. Using the above histogram data the following table was produced; it shows different delay times by airport and their associated percent chance of occurrence.

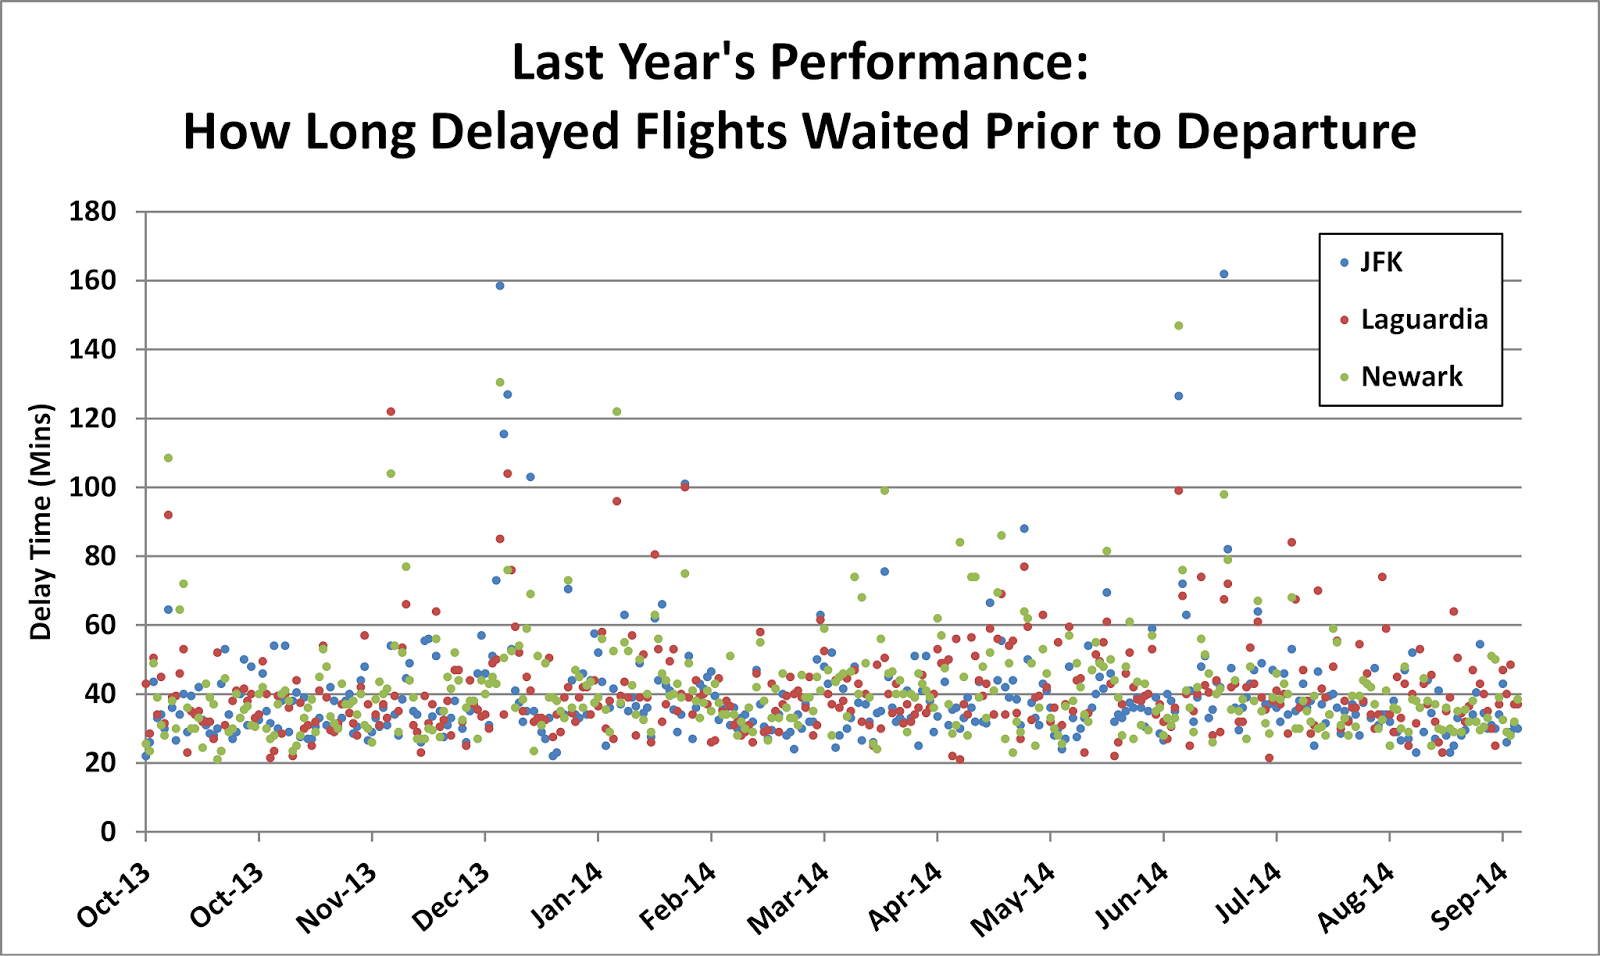
This table helps us understand the range of potential delay. For example, across all airports, there's a 10% chance your wait will be less than 18 mins (so be ready to sit around for longer). In the converse, it's nice to know there's only a 10% chance your wait will be greater than 2.0 hrs. If I had to make a recommendation to set expectations, I would use the middle range (called the interquartile range) of ~25 min to ~77 min. In plain English, this means the following: if you're delayed, you should expect to wait ~25 mins to ~80 mins before you actually take off. This range holds true for almost the entire year, which you can see with the below scatter plot. Notice how almost all delays fall within the 25-80 min range:
Best Airlines To Escape NY
Now your expectations have been set in terms of delay. But your goal in the first place was to avoid delay! You know when to leave NY, but which airline should you select? All of the previously discussed concepts about wait times and percent delayed flights can be applied to each airline carrier. Crunching the numbers, the following table is produced, which shows the performance of each airline flying out of JFK, LaGuardia and Newark; the carriers are ranked by number of flights per year. As you can see, American Airlines, US Airways, and Virgin America have the best performance stats out of all carriers.

Ranking the top three carriers, I would give:
- 1st place to US Airways,
- 2nd place to Virgin America, and
- 3rd place to American Airlines.
In the converse, avoid ExpressJet Airlines if at all possible. They had the worst on-time performance out of the entire group.
In Summary, (1) use the departure chart to figure out the best day and time to leave from your desired airport; (2) choose one of the top-three performing airlines listed above; and (3) be prepared to wait ~25 min to ~80 mins if you are in fact delayed.
And there you have it. Now go escape NY!
______
SAS was used for this analysis; code is available upon request
Source of data from RITA (Research and Innovative Technology Administration - Bureau of Transportation Statistics)
Time range of flight data: 10/1/2013 to 10/1/2014